




















































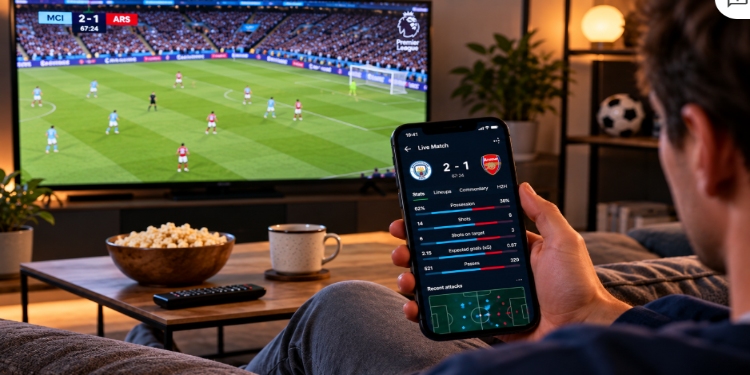
The score is still the first number most fans see. It is no longer the only one they follow.
In football, xG can sit beside the live score. NFL broadcasts show route separation and completion probability. Basketball tracking can describe shot difficulty and player movement before the game is over.


IBM’s 2026 Sports Intelligence Report surveyed 20,589 fans across 12 countries. It found that 72% use sports apps. Among those users, 30% said they were checking live statistics and analytics more often than one or two years earlier.
The same figures can end up in several places. Someone using vip pari may be checking match markets, while another fan is looking at the same team or player data for fantasy purposes. The information can overlap even when the reason for using it is different.
The second screen was already established a year earlier
IBM’s 2025 survey covered nearly 21,000 sports fans.
Among respondents attending live events, 82% said they used a mobile sports app while they were there. Of that group, 91% opened the app during the event itself, mostly for commentary, statistics or analytics.
Generative AI had also started to appear in that routine. Twenty-two percent said they used it regularly and another 30% occasionally. The same study found that 90% consumed some form of sports content beyond simply watching the game.
The 2026 survey moved the picture on again. AI use reached 69% among respondents. Among sports-app users, 40% pointed to having information in one place as a main reason for using an app. Another 35% used them for live updates when they could not watch or listen.
The phone was not replacing the game. It was staying open beside it.
Tracking systems changed the type of numbers fans could see
The NFL’s Next Gen Stats system records player location, speed, distance and acceleration 10 times per second. The league says that creates more than 200 new data points on every play.
That makes separation, expected rushing yards, completion probability and win probability available alongside yards, catches and touchdowns.
The NBA works at an even finer level. Its optical tracking system uses 3D pose detection to follow 29 points on each player’s body at 60 frames per second.
That feed supports measures including:
- expected field-goal percentage and shot difficulty;
- Gravity, or the defensive attention drawn by a player;
- defender pressure and distance;
- speed, movement and positioning.
Two three-point attempts can count the same in a traditional box score. The tracking feed may show that one was taken with a defender arriving late and the other under heavy pressure.
Football followed with a different set of measures
Expected goals became one of the clearest examples.
xG assigns a probability to each chance instead of treating every shot equally. A team taking 15 attempts can therefore look less dangerous than another side taking eight if most of those 15 come from poor positions.
Pressing numbers, possession sequences, player metrics and injury reports fill in other parts of the picture.
That can change how a result is read. Two wins do not always mean two strong performances. A defeat can still contain enough good chances to suggest that the score was harsher than the underlying play.
The commercial side has grown with the data. One 2026 estimate values the global sports analytics market at $3.86 billion, up from $3.05 billion in 2025. The same forecast puts it at $9.64 billion by 2030.
Betting is another place where the numbers travel
Sports markets use much of the information already visible elsewhere.
An injury can affect a team total or a player prop. xG can make a recent scoring run look stronger or weaker. Minutes, usage and efficiency can alter how an individual market is viewed.
Someone checking lines through vippari mobil indir may be looking at the same recent minutes or injury report that a fantasy player has already opened.
The difference is what happens next.
A high xG total still does not guarantee goals. Efficiency over three or four games may not last. Opponent strength can make two similar stat lines mean different things.
The numbers help most when they are read together rather than treated as answers on their own.
More information has changed the baseline
Data that once stayed with team analysts now appears in public apps. Fans can check receiver separation, shot pressure or changes in a player’s workload while the game is still going on.
For many viewers, those numbers have become part of watching sport.

David Prior
David Prior is the editor of Today News, responsible for the overall editorial strategy. He is an NCTJ-qualified journalist with over 20 years’ experience, and is also editor of the award-winning hyperlocal news title Altrincham Today. His LinkedIn profile is here.