


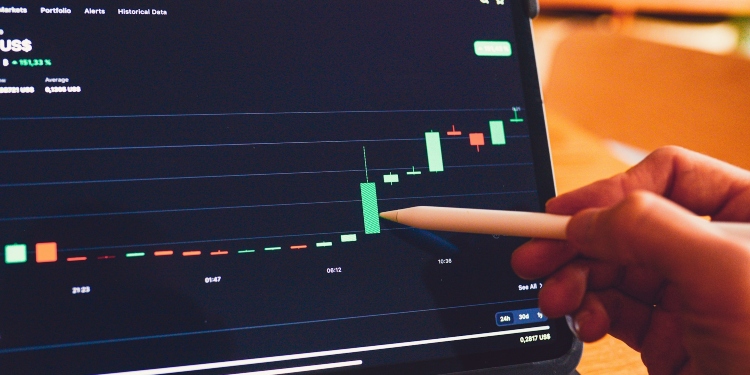
In the world of trading, combining different tools can help create a stronger strategy. Moving averages and candlestick patterns are two popular tools many traders use. Each of them offers valuable information, but together they can provide clearer signals for making decisions. If you’re looking to level up your trading game, understanding how to combine these two tools is a great place to start. Let’s explore how this works and how you can use it to your advantage. Does combining technical indicators seem overwhelming? Visit https://bitiq.live/ to learn more.
What Are Moving Averages?
Before diving into the combination of moving averages and candlestick patterns, it’s important to first understand what moving averages are. Moving averages smooth out price data over a set period of time, making it easier to spot trends. The two most common types of moving averages are:


- Simple Moving Average (SMA): This is calculated by averaging the closing prices of a currency pair over a certain period, such as 50 or 200 days.
- Exponential Moving Average (EMA): This type gives more weight to recent prices, making it more sensitive to price changes compared to the SMA.
Traders often use moving averages to identify the direction of the trend. If the price is above the moving average, it suggests an uptrend, and if it’s below, it indicates a downtrend.
What Are Candlestick Patterns?
Candlestick patterns are another crucial tool in a trader’s arsenal. Each candlestick represents a specific time period (for example, one hour, one day, or even one minute) and provides information about the open, close, high, and low prices during that time. There are various candlestick patterns, each suggesting a potential market movement. Some of the most popular patterns include:
- Doji: This pattern shows indecision in the market, where the opening and closing prices are nearly the same.
- Engulfing Patterns: These can be either bullish or bearish, depending on whether a small candlestick is “engulfed” by a larger one.
- Hammer and Hanging Man: These patterns suggest potential reversals and are found at the bottom (hammer) or top (hanging man) of trends.
Candlestick patterns can help traders predict short-term price movements based on market psychology and sentiment. However, on their own, they may not always offer the most reliable signals. This is where moving averages come in to help confirm trends and signals.
How to Combine Moving Averages with Candlestick Patterns?
Now that we understand what each tool does, let’s look at how they can work together. The power of combining moving averages with candlestick patterns lies in the confirmation they offer one another. When both tools give a similar signal, it can greatly improve the odds of success.
Look for Crossovers
One way to combine moving averages with candlestick patterns is by watching for moving average crossovers. This happens when a short-term moving average (like the 50-period EMA) crosses above a longer-term moving average (like the 200-period EMA). A crossover is often seen as a sign of a trend reversal. If you see a bullish candlestick pattern, such as a hammer, right after a crossover, this could be a powerful signal to buy.
For example, if the 50-period EMA crosses above the 200-period EMA and a bullish engulfing pattern appears, it suggests that the market is likely turning bullish, and it might be a good time to enter a long position.
On the flip side, a bearish crossover (where a short-term moving average crosses below a longer-term moving average) can signal a potential downtrend. If a bearish candlestick pattern, such as a shooting star, forms right after the crossover, this could indicate a strong sell signal.
Use Moving Averages to Identify Trend Direction
One of the best ways to combine moving averages and candlestick patterns is by using the moving average to identify the trend direction. Once you know the trend, you can look for candlestick patterns that confirm the trend’s continuation or potential reversal.
For example, if the price is consistently above a moving average (indicating an uptrend), you can look for bullish candlestick patterns, like a morning star or a bullish engulfing, to enter a buy trade. These patterns suggest that the upward momentum is likely to continue.
On the other hand, if the price is below a moving average (indicating a downtrend), you can search for bearish candlestick patterns, like a dark cloud cover or a bearish engulfing pattern, to enter a sell trade.
Watch for Support and Resistance Levels
Moving averages can also act as dynamic support and resistance levels. When the price is trending upward, the moving average often acts as support. If a candlestick pattern, like a hammer or a bullish engulfing, forms near the moving average support, it could indicate a good entry point to buy.
Similarly, when the price is trending downward, the moving average can act as resistance. If a bearish candlestick pattern forms near the moving average resistance level, it might signal that the price will continue to drop, providing a good entry point for a short position.
Conclusion
Combining moving averages with candlestick patterns offers traders a more complete picture of the market. Moving averages help identify the direction of the trend, while candlestick patterns can offer insight into potential reversals or continuation of that trend. By using them together, you can increase the likelihood of making successful trades.
David Prior
David Prior is the editor of Today News, responsible for the overall editorial strategy. He is an NCTJ-qualified journalist with over 20 years’ experience, and is also editor of the award-winning hyperlocal news title Altrincham Today. His LinkedIn profile is here.