The forex market is a great way to diversify your portfolio by putting money into something separate and unaffected by your other stocks and investments. If you can grasp the fundamentals of the forex market and understand how to perform accurate technical analysis, you can be very successful in trading foreign exchange. There are a number of things you have to consider whilst trading in the forex market. Performing trend analysis and utilising the instruments on trading charts are crucial for a long successful career in forex trading.
What is Forex?
If you are new to the world of forex, then it is a good idea to know what it is and how it functions. The forex market can be described as a decentralised market that allows people to participate in trading forex. It is also the most significant global market, open all day, five days a week. The forex market processes trillions of U.S. dollars daily and sees trades from large financial bodies such as hedge funds, international banks and central banks. Retail investors and forex brokers also make up a significant proportion of all daily trading activity.
When someone trades in the forex market, they are predicting the price movement of a particular currency to move either higher or lower than its current price. For someone to succeed in the forex market, they need to be proficient in analysing the state of the market and factor in things like interest rates, monetary policy, economic growth and political stability, and geopolitics. It takes time, dedication, and experience to become good at analysing the forex market and making the right trading decisions. But it is possible. You must be willing to dedicate sufficient time and energy to track announcements relating to the economy and act fast to take advantage of good opportunities that arise.
The Trends
Accurately identifying trends in the forex market is a key skill to have as a forex trader. It will significantly help you make accurate predictions regarding future price movements of currencies and increase your success and potential gains. Trends can generally be categorised into long-term, intermediate, and short-term. If you can successfully identify trends in the forex market, you increase your chances of making profits considerably. As a rule of thumb, if you notice a general trend of the forex market going up, you should be careful in taking a position that requires the trend to move in the other direction. Trends can also be found in things like equities and interest rates. They can even be found in any market that can be categorised by changes in price or volume.
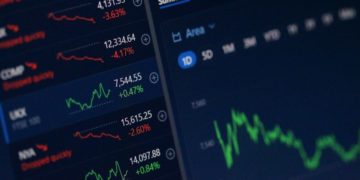
There are downward, sideway, and upward trends, three of the most important trends you should learn to identify in the forex market. If you notice an upward trend when compared to the graph, then the currency you are looking at is increasing in value. On the other hand, if there is a downward trend compared to the graph, then the value of the currency is decreasing.
Types of Forex Trading Charts
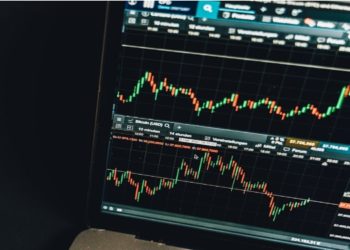
There are several types of forex trading charts; however, the most important ones include bar charts, candlestick charts, and line charts. Bar charts are useful for finding trends in the market and contain important information such as the opening and closing prices and the high and low currency pairs’ prices. They are extremely helpful for analysing the market. However, they do take some practice and skill to understand.
Line charts are much simpler charts that display a currency’s price over a specific period. They are especially useful for finding trends that can be described as long-term, and they only show the closing price. Line charts do not show as much data as the other charting types. However, they should be used in addition to the other types. Candlestick charts are arguably the most popular type of charting that forex traders use every day. One of the main reasons traders opt for this type of trading chart over others is that many traders find it easier to interpret. They allow the identification of market trends and flag any potential opportunities for a good trade.
How to Use Charts for Trend Analysis
Charts can be used for trend analysis by selecting a specific time frame to analyse and decide whether or not there is a trend. An upward trend means that currency pair prices are increasing over a period of time. This is known as a bullish market. A downward trend means that currency pairs are decreasing over a period of time; this is known as a bearish market. Being able to identify this will significantly improve your analysis of the market and improve your trading decisions.
How to Use Charts for Predictive Trading
Charts can also be used for predictive trading, which is when a trader can predict the future price movements of a currency through technical analysis of the chart. The most important part of predictive trading is to remember that you need to constantly monitor the market and look for signs that give indications about how a price may move.
David Prior
David Prior is the editor of Today News, responsible for the overall editorial strategy. He is an NCTJ-qualified journalist with over 20 years’ experience, and is also editor of the award-winning hyperlocal news title Altrincham Today. His LinkedIn profile is here.


